IELTS / Writing practice / Section U7EP
Writing practice · section U7EPPage 1 of 2
Writing Task 1 · about 20 minutes
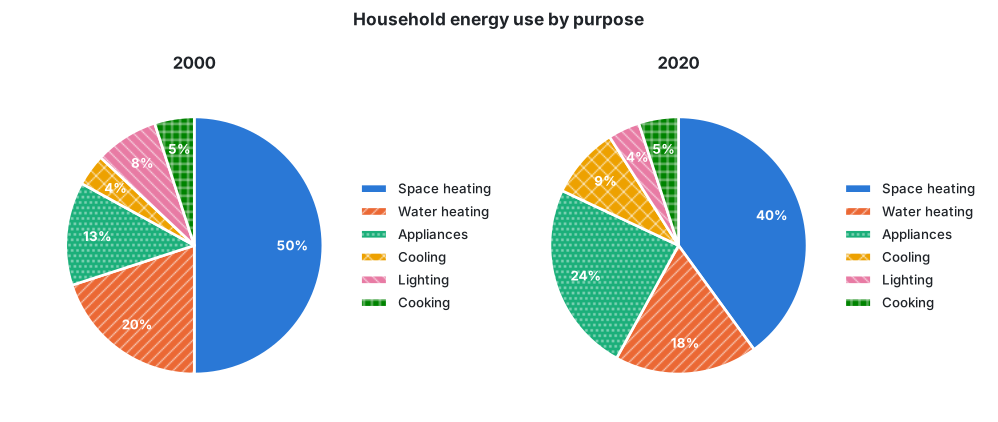
The pie charts below show how energy was used in the average household in one country in 2000 and 2020.
Summarise the information by selecting and reporting the main features, and make comparisons where relevant.
Write at least 150 words.
0 words · at least 150