IELTS / Writing practice / Section N422
Writing practice · section N422Page 1 of 2
Writing Task 1 · about 20 minutes
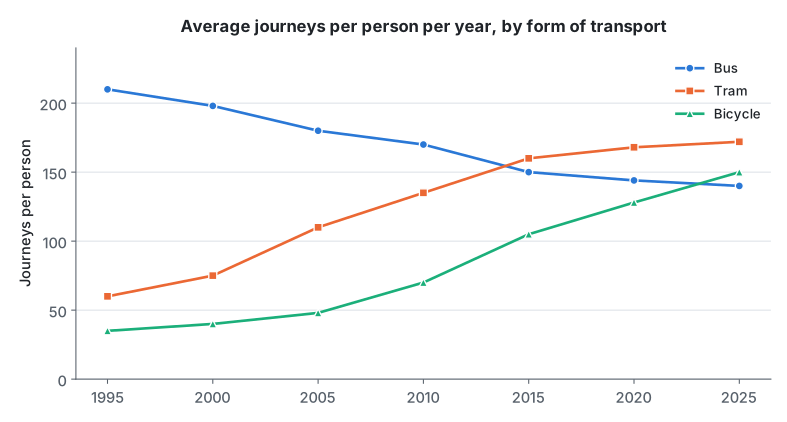
The graph below shows the average number of journeys made per person each year by three forms of transport in one European city between 1995 and 2025.
Summarise the information by selecting and reporting the main features, and make comparisons where relevant.
Write at least 150 words.
0 words · at least 150