IELTS / Writing practice / Section 3AT7
Writing practice · section 3AT7Page 1 of 2
Writing Task 1 · about 20 minutes
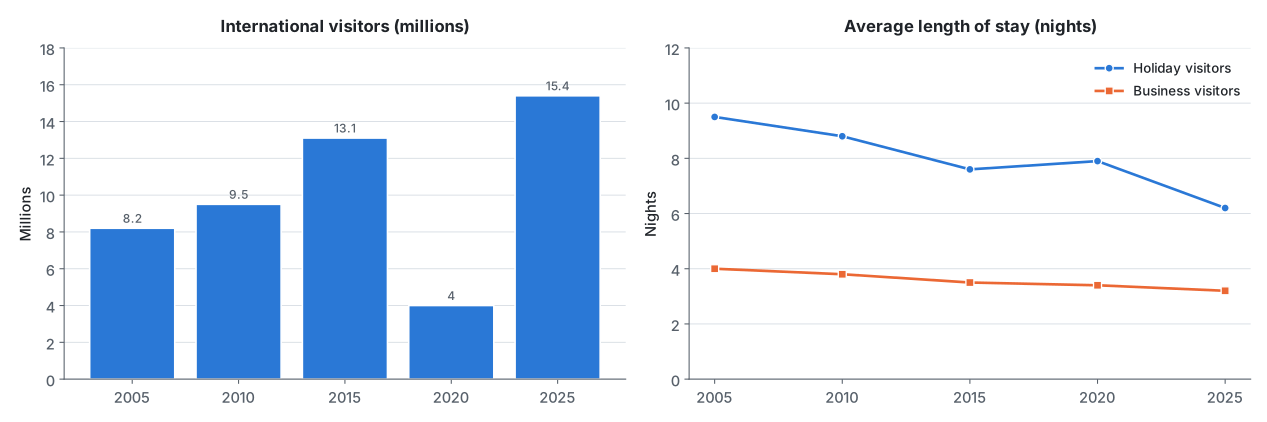
The bar chart below shows the number of international visitors to one country in five different years. The line graph shows the average length of time that holiday visitors and business visitors stayed.
Summarise the information by selecting and reporting the main features, and make comparisons where relevant.
Write at least 150 words.
0 words · at least 150